Cross-tab reports
The cross-tabulation tool allows you to measure the interaction between two questions (variables). The table will only show respondents that answered both of the questions, meaning the frequencies shown may differ from a standard frequency table. The cross-tab report will also show Pearson’s Chi-Square Statistics, which shows the level of correlation between the variables using the chi-square, p-value, and degrees of freedom.
- My Surveys (Select Survey) » Analytics
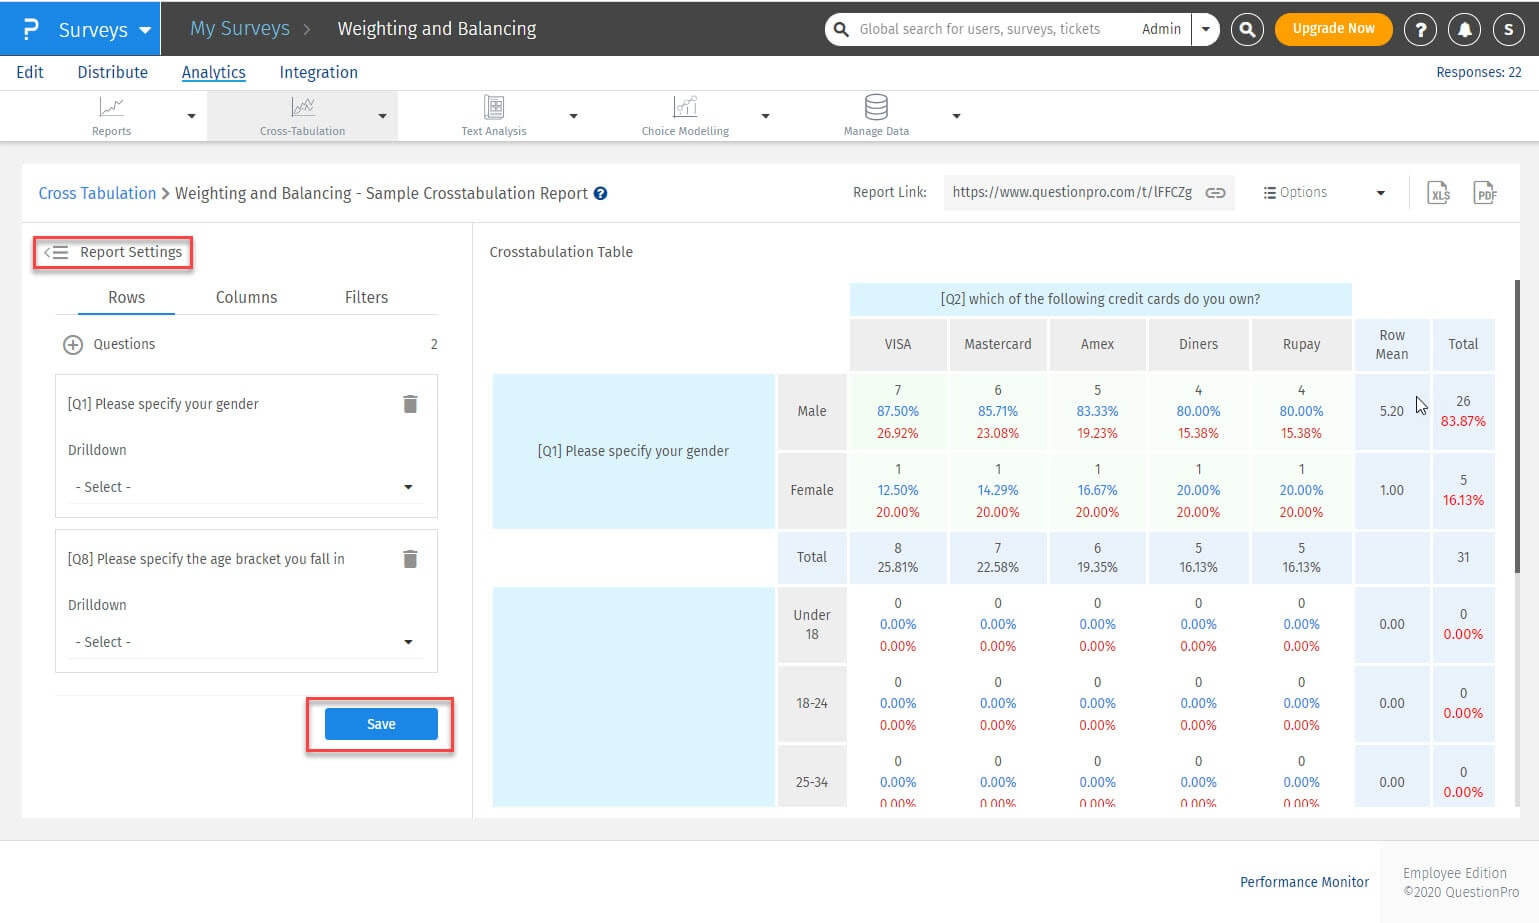
- Click on Cross-Tabulation under Analysis
- Select a row question and a column question from the left collapsible settings
- you can drill down further 1 level in both row and column questions
- Click on Save to generate a cross tabulated report.


Yes, to filter the data, go to filter tab in the Report settings. You can filter the data based on the following:
- Responses to Questions
- System Variables
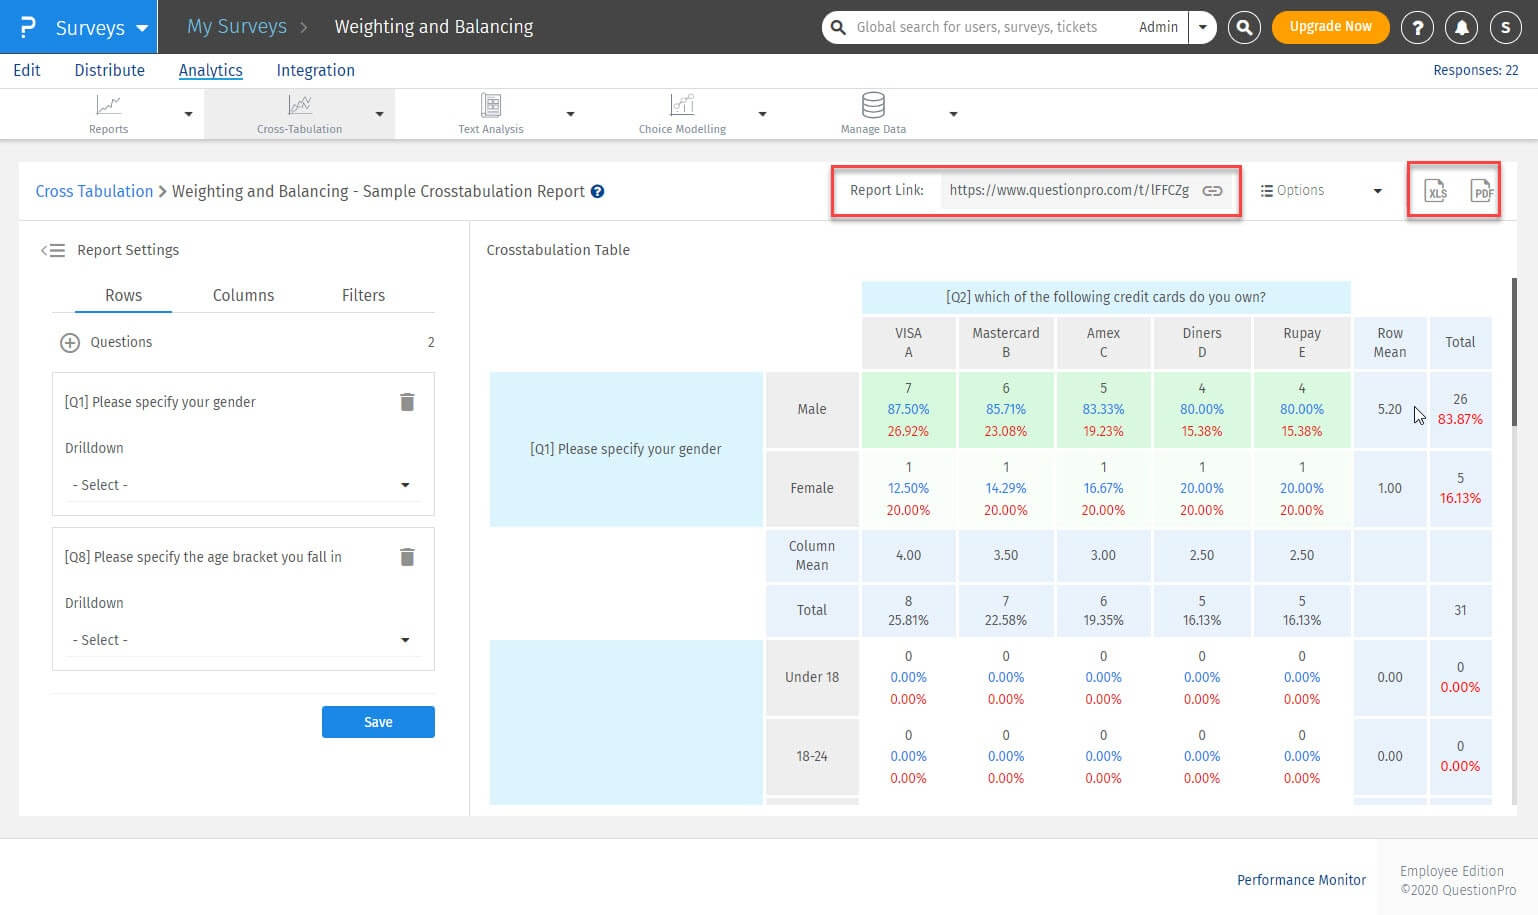
Yes, you can share the report using the sharing link.

Yes, you can download the report in the following formats:
- Excel
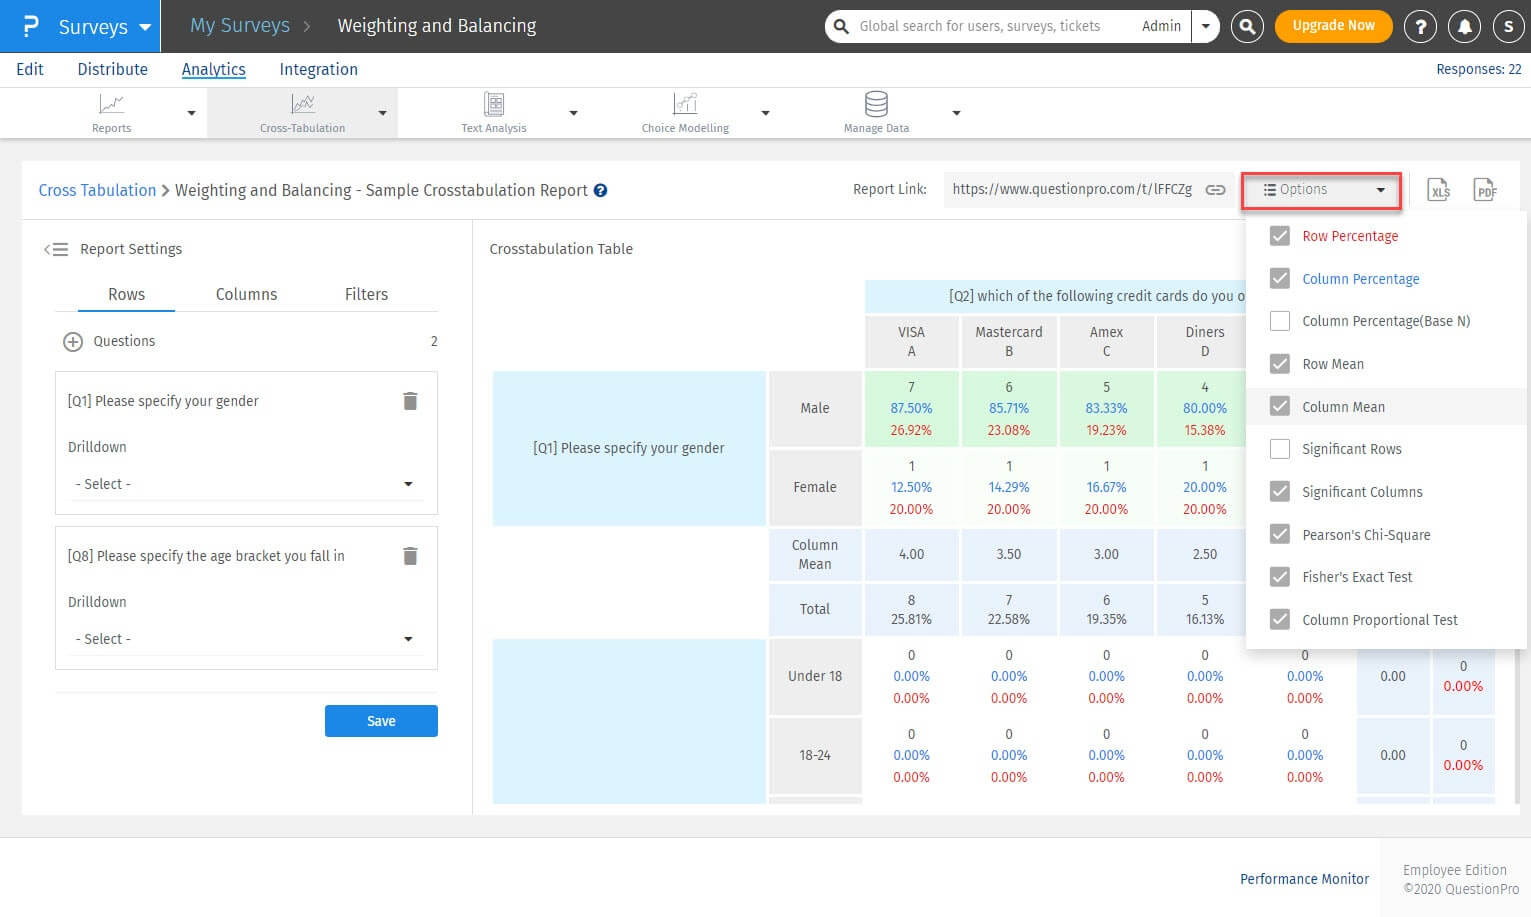
We support following analysis depending on the license level.
| Statistical analysis | License |
|---|---|
| Row Percentage | Advanced, Team Edition and Research Edition |
| Column Percentage | Advanced, Team Edition and Research Edition |
| Row Mean | Advanced, Team Edition and Research Edition |
| Column Mean | Advanced, Team Edition and Research Edition |
| Significant Rows | Research Edition |
| Significant Columns | Research Edition |
| Pearson's Chi Square | Research Edition |
| Column Proportion Test | Research Edition |
| Fisher's Exact Text | Research Edition |

This feature is available with the following licenses :

